We are accustomed to using GPS to give us our location, but did you ever wonder how sailors were able to navigate around the world before the days of GPS?
With ocean currents, changing winds, dense fog, angry storms, relentless waves, and no landmarks in sight on the open seas, how could a ship set off from Boston and have any chance of reaching Bombay thousands of miles away? Yet in the 1600-1800s, global shipping was a big business, with ships routinely sailing from Europe and the Americas to ports in the Far East and back again.
While there are no visible landmarks in the ocean, there are marks in the sky—the sun and stars. Navigators used tools like the sextant in determining their ship’s longitude and latitude. The sextant allowed a navigator to measure the angle between the sun or star and the horizon.
Navigators used that information combined with data in charts onboard the ship to plot their location and help the captain chart the ship’s course. If they could not use their sextant to measure their position (for example, when thick fog persisted for days on end) navigators were helpless.
You do not need to feel adrift at sea when it comes to knowing where you are with your marketing. The previous articles in this series were all intended to help you get your bearings and chart a course with confidence so you don’t get lost in the marketing ocean.
A tool for calculating ROI
This article is the second of two articles about testing and measuring your marketing. Calculating the return on your marketing investments (ROI) is a feedback mechanism like a sailor’s sextant. You need to know the state of your marketing benchmarks to make sure you are still on the right course. Getting blown off your course means that you will waste money and resources on ineffective marketing.
At Rosewood we use a simple spreadsheet tool (pictured below) to calculate marketing ROI. You can also calculate marketing ROI with a few simple entries on your calculator using a paper worksheet. You can email grow@rosewood.us.com to request a free copy. Please specify paper worksheet or Excel file.
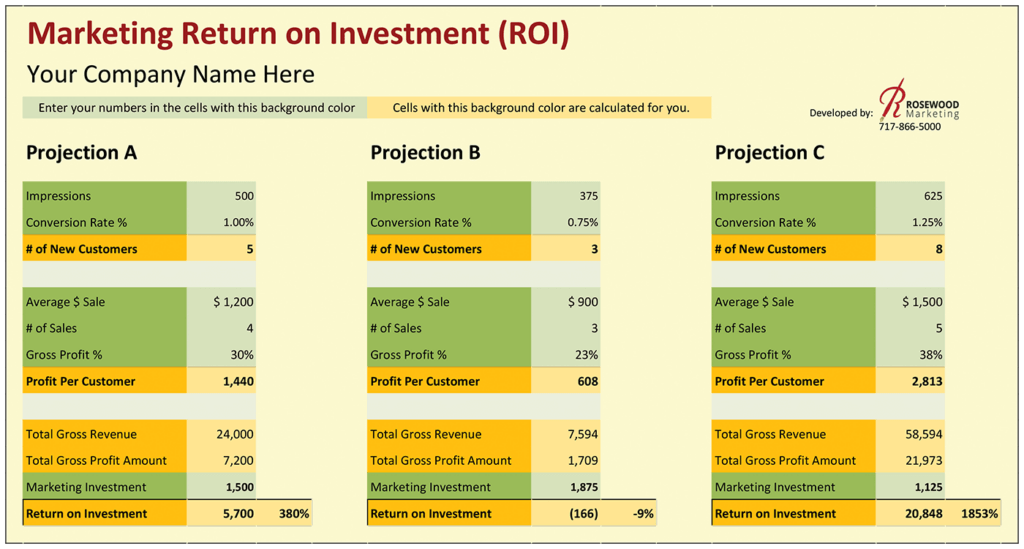
This spreadsheet can be used post-campaign to calculate campaign results, or you can you use it pre-campaign to do a dry run through multiple scenarios. If all your pre-campaign scenarios result in a negative ROI, then you know that you need to look for a better place to spend your marketing money.
Understanding the terms—and the math
Whether you use this tool or not, the rest of this article explains the different terms you need to understand along with the math needed to calculate your ROI.
Impressions: The number of impressions is the number of prospective buyers reached by a particular marketing campaign.
For example, you might send a direct-mail campaign to 500 addresses, or you might advertise in a specialty newsletter with 500 subscribers, or you might exhibit at an event with 500 attendees. In your calculations, you may choose to narrow the total number of potential customers reached to only those who are potential buyers. For instance, you may exhibit at an event with 2,000 attendees, but if you already know that only 500 of those are potential buyers, you would use 500 instead of 2,000.
Conversion Rate: The conversion rate is the percentage of prospects who convert to customers. For our example, we will use a 1% conversion rate. As part of your planning, you can plug in different conversation rates on the spreadsheet and see how your ROI changes. It’s best to stay conservative when estimating a conversion rate.
Number of New Customers: The number of impressions times the conversion rate equals the number of new customers acquired through your marketing campaign (500 x .01 = 5 new customers).
Average Dollar Sale: This number comes from taking gross revenue (total sales) and dividing it by the number of purchases. When projecting an estimate for a campaign you plan to run, use the average dollar sale based on numbers you already have. For example, here is an easy way to calculate this for a year:
1. Find the first and last invoice numbers for the year. Subtract the first invoice number from the last invoice number. This is the number of transactions for the year.
2. Divide gross revenue by the number of transactions. This is your average dollar sale.
Example:
- Last invoice number: 2155
- First invoice number: 1655
- Number of transactions: 500
- Gross revenue: $600,000
- Number of transactions: 500
- $600,000 divided by 500 = $1,200 average dollar sale
Number of Sales: The number of sales is how many times the average customer makes a purchase. Depending on your business, your customers may purchase only once in a lifetime. In other businesses, customers return several times a week.
The number of sales is calculated for a specific time period, such as a month, a year, several years, or the expected purchasing lifetime of a customer. Use the same time period for both average dollar sale and number of sales.
Based on the example above, let’s calculate the number of sales for a year. First, find how many customers purchased from you in the year. If you have a business from which customers only purchase once in a lifetime, you could use the number of invoices (500). But many businesses have return customers within a year, so we will use 125 customers.
Divide 500 invoices by 125 customers to average four sales per customer. While some bought seven or eight times, others bought only one or two times, so the average is four invoices per customer.
Gross Profit Percent: It is important at this point to understand the difference between gross profit and net profit. (Figure 2)
Gross profit equals the gross revenue minus the cost of the materials and cost of the production labor for those sales. It does not consider overhead costs such as rent, utilities, overhead labor, or janitorial supplies. Marketing return on investment (ROI) is calculated using gross profit. “Why?” you may ask.
Let’s say our example business is making a profit each month. On the last day of the month at five minutes before closing time, a customer comes in. At this point all the overhead costs are covered (paid) with the gross profit from previous sales and there is already a profit for the month.
This last-minute customer buys $1,200 of product with a 30% gross profit. What happens to the net profit for the month? You are right—it increases. By how much? Thirty percent of $1,200, which equals $360. How much would you be willing to pay to bring that last-minute customer in? Do you see how gross profit is important to know when calculating your marketing ROI?
In this example, we are not using marketing dollars to make the business profitable, but to make it more profitable. What if your business is operating at a loss? The calculation is the same because every sale decreases the loss by the amount of gross profit.
Profit Per Customer: Average dollar sale times the number of sales times gross profit percent equals the profit per customer.
Total Gross Revenue: Total gross revenue yielded by your marketing campaign equals the average dollar sale times the number of new customers times the number of sales. In our example, gross revenue looks like this: $1,200.00 x 5 x 4 = $24,000.00.
Total Gross Profit Amount: The total gross profit is the gross profit from all the sales to your new customers ($24,000 x 30% = $7,200).
Marketing Investment: The marketing investment is the amount of money you invested in the marketing campaign. Be sure to figure all the items, including the labor for trade shows and other things that take your employees’ time. If you offer a discount incentive or free product you must also calculate that in. The investment of our example campaign is $1,500.
Return on Investment (ROI): Return on investment equals the total gross profit minus the marketing investment ($7,200 – $1,500 = $5,700). The percent of return is calculated by dividing the return on investment by the marketing investment ($5,700.00 ÷ $1,500.00 = 3.8 or 380%).
Making Projection Decisions
Take a look at the chart showing the comparisons A, B, and C. The numbers in column B are adjusted 25% for the worse. The numbers in column C are adjusted 25% for the better. Notice how small changes in the same direction on all the numbers make an exponential difference on the bottom line. It is very easy to make the projection show what you want it to show-but what you want it to show is not a good guide. Be intentional about making your projections realistic.
You may think that a 380% return is fabulous. That is much more than the bank will pay; but the bank doesn’t work as hard as you do. You also have an element of risk in every campaign, even if you have done it successfully before. As a rule of thumb, when considering a new marketing campaign that you have no experience in, invest only in campaigns where you expect a 300% return or more. If that is unrealistic, look for better opportunities.
What if you projected a 380% return but the actual was only 150%? Should you run that campaign again? It depends. If this is your first campaign in a new business, you have made a great step forward. You have identified a campaign that works! Repeat the campaign again after considering changes that might be more effective.
On the other hand, if you are in a mature business, and twelve other campaigns had a better ROI, you may want to discard a campaign with a return of only 150%. However, ask yourselves some questions first: Why did it not work as well as you projected? Could you make some changes to improve its effectiveness?
There are many links in the chain of a campaign. If one link is weak or missing, the campaign will suffer. Consider an ad in a publication. Does your target market read the publication? Is it the right time of the year? Have you run the same ad message for too many months? Is the ad designed in a way that attracts attention and builds trust? Did the message fail to connect?
Conclusion
Unless you test, measure, and calculate the ROI of your marketing, you are operating like a ship in deep fog. You lack a reliable way of knowing whether your marketing is getting better or worse, or whether it is effective at all.
Sometimes we have a gut feeling about the effectiveness of our marketing. We take into account anecdotal evidence—a customer story or a busy day at the shop. Sometimes that’s accurate, but sometimes it is not. You’ll be in a much stronger position if you do the hard work of calculating your marketing ROI to the most accurate degree possible.